Our platform clearly offers extensive data tracking reports about your interactive 360° virtual tours. With these reports, you gain insight into the use of the panoramas, which ones are popular, for where are they being seen, which hw and browsers are being used, are they using a mobile device, tablet, or desktop, etc. Below, you’ll find some example reports that can be generated from within our system.
Reports
Powerful reports can be used to give insights into your interactive 360° virtual tours.
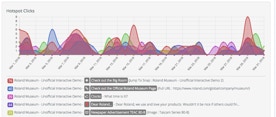
Hotspot Click Report
The hotspot click reports shows how many times there has been clicked on a specific hotspot. It gives you the knowledge which content is the most interesting for your viewers. For example, you can track leads per panorama and figure out how many came through with the push of the phone hotspot. See how many people look at information you provide through text boxes, how many listen to your narration, etc.
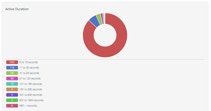
Active Duration Report
This report tells you how long someone is looking at your panorama. It shows which panoramas are the most interesting to your viewers.
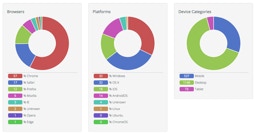
Browser Report
This report is split into 5 parts (3 are shown here):
Browser - which internet browser is being used.
Platform - which operating system is being used
Device Category - Is the panorama being viewed by a mobile device, tablet, or desktop. This information is important to know so that you can adjust other means of communication to your users, i.e, if mobile devices are being used more, perhaps you may want to alter your website to be more mobile friendly.
Devices - See which computer/mobile is being used
Top 30 countries - This gives a percentage per region from where the panorama is being viewed.
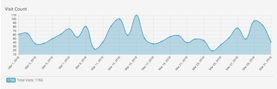
Visit Count Report
This report show how popular the vr tour is over a specific amount of time. You can use this to determine when it is best to do announcements, facebook ads, etc..
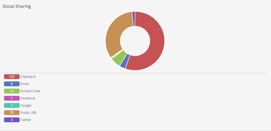
Social Sharing Report
Do you want to know how your virtual tours are being shared? This reports show exactly that. It tells you which social platform or which way is the best means of telling your story.
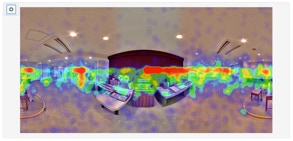
Heatmap Report
This hotspot report is a unique way of getting insight where on a panorama your viewers are clicking the most. You can learn from it what aspects of the tour are the most popular and where you should focus on with your communications. You can even enhance the views by changing the variables.
Copyright © Reichgelt 2018 - All rights reserved